

Deep Dive Analysis: Amcor plc
Why the market is mispricing a defensive cash-compounder due to $300M in integration noise.
Quick View
Ticker: AMCR
Sector: Paper & Plastic Packaging Products & Materials.
Theme: Defensive cash-compounder utilizing M&A to generate scale and shareholder returns.
TBFG angle: A high-yielding cash compounder undergoing a structural transformation through the Berry Global merger, presenting a highly depressed forward valuation but carrying elevated integration and leverage risks..
TBFG Bottom Line
The legacy business model of Amcor plc was a textbook Peter Lynch Stalwart — robust, defensive, capital-intensive, yet generating consistent, slow-growing cash flow to support an attractive dividend. However, the $10.4 billion all-stock acquisition of Berry Global, completed on April 30, 2025, has completely rewritten the investment thesis.
The transaction has scaled the combined company’s annualized revenue to $23 billion and expanded its footprint to over 400 manufacturing facilities globally. This dramatic leap in scale has introduced structural leverage and integration complexities that have severely weighed on trailing per-share profitability.
GAAP net income for the year ended June 30, 2025, declined to $518 million from $740 million in the prior year due to $307 million in restructuring, transaction, and integration costs. The market has reacted to this GAAP dilution and the elevated debt load with skepticism, keeping the stock depressed.
Yet, this skepticism is backward-looking. On a forward-looking basis, Amcor trades at an exceptionally low Forward P/E of 9.1x, backed by run-rate adjusted EBIT and an ambitious $650 million pre-tax synergy target scheduled to fully realize by fiscal year 2028.
This combination of a depressed forward multiple, recession-resistant volume baselines, and a trailing annual dividend yield of 7% makes the investment profile highly compelling.
For a disciplined, long-term investor willing to look past short-term integration noise, Amcor plc is categorized as attractive at the current price of $37.5.
TBFG MAY OFFER: 90% OFF FOR LIFE
Business Snapshot
Amcor is a global leader in developing and producing flexible and rigid packaging, specialty cartons, and closures. The company operates primarily in two segments: Flexibles (historically ~78% of sales) and Rigid Packaging (~22%).
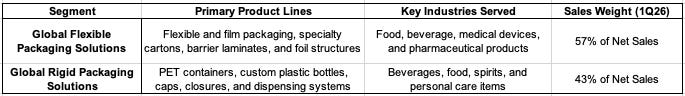
The combined company dominates its primary packaging niches in North America and Western Europe, while deriving 27% of its sales from higher-growth emerging markets. Amcor’s primary revenue engine is structurally defensive: approximately 95% of its post-merger sales are directed toward non-discretionary consumer staples and healthcare end-use applications.
The business model generates defensive sales volumes because packaging is an essential, low-cost component of the customer's final product, making demand highly inelastic even during macro-economic contractions.
Management & Governance
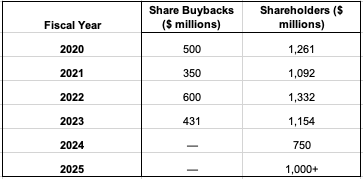
Led by CEO Peter Konieczny and CFO Steve Scherger, Amcor operates with a highly structured "Shareholder Value Creation Model" targeting 10-15% total annual returns. Management is aggressively focused on cash generation and capital discipline, historically allocating ~750 million to dividends, 500 million to reinvestment, and ~$300-400 million to acquisitions and buybacks annually.
To counteract stock dilution and structural per-share distortion resulting from the issuance of ordinary shares to fund the Berry merger, the Board authorized a 1-for-5 reverse stock split, which was completed on January 14, 2026. This consolidated the post-merger share count down to approximately 462 million outstanding shares.
However, from an accounting perspective, the massive influx of assets has led to significant transparency hurdles. The primary governance and accounting "red flag" lies in the ongoing adjustments to the "Berry Plan". During the second quarter of fiscal year 2026, the company recorded $15 million in inventory discrepancies, including errors from prior periods, tied directly to legacy manufacturing inefficiencies and oversight issues. Management utilized these findings to justify the immediate closure of three legacy facilities in Asia. While forensic auditing of acquired entities is expected, persistent non-recurring charges and restatements represent a key area of operational execution risk that BFG will monitor closely.
The governance structure strongly favors inorganic growth to overcome slow organic trends; they successfully integrated the transformational Bemis acquisition in 2019 (exceeding synergy targets) and are currently executing an Amcor and Berry combination designed to uplift annual cash flow to $3+ billion.
Market & Competitive Landscape
Amcor operates in a mature, capital-intensive industry with low structural growth. Competitive advantage (the “Moat”) is driven by two key mechanics:
Switching Costs in Regulated Sub-Segments: In medical device, sterile barrier, and pharmaceutical packaging, switching suppliers is highly problematic. Customers must comply with strict, multi-year healthcare regulatory certifications. Amcor’s specialized thermoforming capabilities and proprietary packaging technologies, such as the AmPrima and AmFiber platforms, embed the company deeply within customer supply chains.
Scale-Driven Procurement and Cost Advantages: Following the merger, Amcor has become the undisputed global packaging leader by volume (212 locations in 40 countries). Its massive scale provides substantial leverage in purchasing raw inputs — such as polyethylene, polypropylene, and aluminum — which are highly exposed to commodity cycles.
The primary vulnerability to this moat is the commodity pass-through lag. Changes in raw polymer resin prices are passed on to consumer goods clients through contract clauses, but this typically incurs a lag of 3 to 6 months. During periods of rapid commodity price inflation, this lag depresses profit margins. Furthermore, the packing industry is fragmented, and regional competitors often compete aggressively on price, limiting structural pricing power to highly customized, sustainable, or sterile packaging formats.
Financial Trajectory
Amcor's financial trajectory is characterized by steady margins and strong cash conversion, despite recent top-line stagnation. Revenue grew from $9.1 billion in 2017 to peak at $14.7 billion in 2023 (bolstered by the Bemis acquisition and pricing power), before softening to $13.6 billion in 2024 due to customer destocking and lower raw material pass-through costs.
Operating margins have remained remarkably consistent, hovering between 10% and 12% across different macroeconomic environments. Return on average funds employed (ROFE) is typically strong, registering between 15% and 16% in recent years.
A deep-dive analysis of Amcor's trailing financial reports reveals a clear divergence between GAAP reported performance and non-GAAP operational trajectory. Net sales have experienced a structural jump due to the consolidation of Berry Global :
While reported GAAP revenue reached $15,009 million in fiscal year 2025, operating income fell to $1,009 million from $1,214 million in fiscal year 2024, resulting in a GAAP operating margin compression from 8.9% down to 6.7%. This compression was entirely driven by $307 million in merger-related restructuring and integration costs alongside a rise in the amortization of acquired intangibles to $246 million.
Adjusted EBITDA grew by 88% to $2,628 million for the nine months ended March 31, 2026, compared to $1,397 million in the prior year period. Crucially, margins are benefiting from the early execution of cost-saving plans, with the Adjusted EBITDA margin expanding from 14.1% up to 15.4%. This margin expansion is key to driving return on invested capital (ROIC) higher, which historically hovered around 8-9% due to the massive goodwill balances of $5,339 million that arose from the Bemis acquisition and have now expanded further due to the $10.4 billion Berry purchase.
Growth Drivers & Strategic Optionality
Because Amcor is a slow-growing Stalwart, its future catalysts rely heavily on strategic shifts and M&A:
The Berry Integration: The combination with Berry Global is the primary near-term catalyst, projected to deliver massive synergies, drive EPS growth to 10-15%, and expand the annual cash flow profile to $3+ billion.
Portfolio Optimization: Management is executing a portfolio review focusing on a ~$20 billion core market of high-margin, high-growth categories like Healthcare, Beauty & Wellness, and Advanced Solutions.
Sustainability Premium: As global brands mandate eco-friendly packaging, Amcor’s massive investments in recycle-ready and bio-based materials give it strategic optionality to capture market share from slower-moving competitors.
Financial Quality, Cyclicality, and Execution Risk
Inverting the thesis (the Pre-Mortem) reveals three structural risks that could permanently impair the company:
Balance Sheet Over-Leverage and Deleveraging Failure: The acquisition of Berry Global has fundamentally compromised Amcor’s historical low-debt balance sheet. As of March 31, 2026, long-term debt ballooned to $15,200 million. Net debt stood at $14,081 million at December 31, 2025, pushing the leverage ratio to 3.8x Net Debt to Adjusted EBITDA. Management has targeted a reduction of this leverage to 3.1x–3.2x by June 30, 2026, excluding asset divestments.
However, if high interest rates persist globally, or if credit rating agencies execute a formal downgrade (such as occurred in May 2024 when a major rating agency placed the outlook on negative ), interest costs will continue to escalate. Interest expense had already risen to $396 million in fiscal year 2025 , and grew further to $460 million in just the first nine months of fiscal year 2026. Any permanent failure to rapidly pay down debt will result in structural cash flow leakage, directly threatening the sustainability of the 7% dividend yield.
Integration Diseconomies and Synergy Attrition: Packaging roll-ups of this size are structurally prone to integration friction. The legacy businesses operate on different enterprise resource systems, utilize distinct supply networks, and possess differing corporate cultures. If customer concentration leads to the loss of key accounts during the plant consolidation process, or if the estimated $530 million in cost synergies is eaten up by higher-than-expected freight, labor, or local operational disruption costs, Amcor will have permanently diluted its ROIC on a massive, low-growth capital base. YTD restructuring and integration cash costs of $262 million show the heavy capital toll of this process.
Environmental Regulation (”Plastic Backlash”):
Amcor’s long-term operations are structurally exposed to global regulatory and consumer crackdowns on plastics, which constitute the vast majority of its rigid packaging and flexibles lines. Increasingly strict single-use plastic bans, carbon taxes, and mandates for post-consumer recycled (PCR) content in regions like the European Union and North America present severe structural headwinds. While Amcor has set goals to achieve 30% recycled content by 2030, and notes that 90% of its flexibles are "recycle-ready" , the transition requires substantial growth CapEx and R&D spending, which may permanently depress free cash flow conversion.
Valuation
Owner Earnings represents the actual, non-discretionary cash generated by the business, decompressing the distortions of GAAP amortization and capital expenditure:
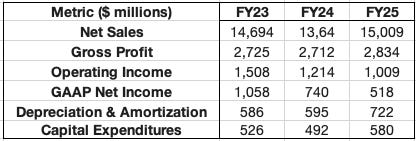
Owner Earnings Calculation: Owner Earnings = (GAAP Net Income + Depreciation, Amortization & Impairment ) - Total Capital Expenditures.
Owner Earnings (FY23) = $1,058 million + $586 million - $526 million = $1,118 million.
Owner Earnings (FY24) = $740 million + $595 million - $492 million = $843 million.
Owner Earnings (FY25) = $518 million + $722 million - $580 million = $660 million.
Note: Total CapEx is used as a conservative proxy because Maintenance CapEx is not explicitly separated in the provided cash flow statements.
By adjusting for non-cash depreciation and heavy post-merger amortization, the company generated $660 million in structural owner earnings in fiscal year 2025. This cash-generating power is set to expand rapidly in fiscal year 2026. Non-GAAP projections for the full fiscal year 2026 target an Adjusted Free Cash Flow of $1.8 billion to $1.9 billion as the full annual run-rate of Berry Global is captured and capital expenditures normalize to a projected range of $800–$900 million.
Historical Revenue Growth Rate (5-Year CAGR): To establish a normalized growth baseline, we compute the 5-year historical revenue growth rate from the legacy business before the full-year inclusion of Berry Global:
FY20 Net Sales = $12,468 million
FY25 Net Sales = $15,009 million
Historical Revenue CAGR = 3.78% per annum
PEGY Ratio Calculation: PEGY ratio divides the Price-to-Earnings multiple by the sum of the growth rate and the dividend yield:
PEGY = (P/E) / (Growth + Dividend Yield)
(Numbers used: Trailing P/E = 29.5, Forward P/E = 9.1, Historical Organic Revenue Growth = 3.78% (from FY21), Dividend Yield = 7.0%).
Trailing PEGY: 29.5 ÷ (3.78 + 7.0) = 2.74
Forward PEGY: 9.1 ÷ (3.78 + 7.0) = 0.84
The Trailing PEGY of 2.74 reflects a business temporarily burdened with transaction friction, restructuring outlays, and non-recurring GAAP penalties.
However, the Forward PEGY of 0.84 falls comfortably below BFG's strict threshold of < 1.0, highlighting that once the operational synergy benefits are fully realized, the stock is significantly underpriced relative to its combined growth profile and defensive yield.
TBFG Positioning View
From a portfolio construction standpoint, Amcor plc represents a classic value turnaround in a defensive sector. The sheer size of the post-merger company has temporarily obscured its cash-generating power, creating a valuation mismatch. While the debt load of $15.2 billion requires rigorous monitoring, the recession-resistant nature of 95% of its packaging end markets provides a highly predictable revenue baseline that mitigates structural insolvency risk.
TBFG views Amcor plc as Attractive at the current price of $37.5.
The stock offers a clear asymmetric risk-reward profile, with a Forward PEGY of 0.84, an expected $1.8–$1.9 billion in run-rate Free Cash Flow, and a solid 7% dividend yield that cushions the holding period as deleveraging is achieved.
We recommend initiating a position in the defensive/high-yield bucket of the portfolio, capped at a conservative 3.0% total allocation size to account for execution risks. The core operational trigger to sell or re-evaluate the thesis is a persistent contraction in the consolidated Adjusted EBIT margin below 10.0%, or a failure to reduce leverage below 3.3x by the end of fiscal year 2026.